Coastal-pluvial compound flood inundation mapping example
This notebook demonstrates how to use pyGeoFlood to map coastal-pluvial compound flood inundation. The example focuses on a portion of the city of Port Arthur, Texas, USA. In this notebook we will:
Download a 1m DEM for the area of interest.
Use pyGeoFlood to separately calculate coastal and pluvial flood inundation for two hypothetical scenarios.
Coastal scenario: 1.2 m NAVD88 coastal water level.
Pluvial scenario: 20 cm of uniform rainfall.
Approximate compound inundation by merging the two maps.
We make a conservative assumption that compound inundation depth is the maximum of the coastal and pluvial depths.
Visualize the results.
Google Colab users: run the cell to below to install pyGeoFlood and its dependencies.
[1]:
try:
    from google.colab import drive
    print('intalling pyGeoFlood in Google Colab')
    !pip install pygeoflood contextily
    !git clone https://github.com/mdp0023/richdem.git
    !cd richdem/wrappers/pyrichdem && pip install "setuptools<81" && pip install .
    !pip install numpy==2.0.2 --force-reinstall
except ImportError:
    print('see pyGeoFlood README for local installation instructions')
    pass
see pyGeoFlood README for local installation instructions
Import libaries
[2]:
import contextily as cx
import numpy as np
import matplotlib.pyplot as plt
import rasterio

from mpl_toolkits.axes_grid1 import make_axes_locatable
from pathlib import Path
from pygeoflood import pyGeoFlood
from rasterio.plot import plotting_extent
Download the example DEM and instantiate the pyGeoFlood class.
Click here for more info about the DEM.
[ ]:
# download DEM, put in project directory
project_dir = Path("pa_pluv_coast")
project_dir.mkdir(exist_ok=True)
!curl https://utexas.box.com/shared/static/k2r7y204llmudeb5jc2xs2sz23rcx5s1.tif -Lso {project_dir}/pa_1m.tif

# pyGeoFlood automatically sets the project directory to the DEM directory
# a custom directory can also be set with pgf.project_dir = "path/to/project_dir"
pgf = pyGeoFlood(dem_path="pa_pluv_coast/pa_1m.tif")
Run Fill-Spill-Merge to create a pluvial flood inundation raster. We route a uniform depth of 0.2 m through the DEM’s depressions.
[4]:
pgf.fill_spill_merge(uniform_depth=0.2)
Running fill_spill_merge with parameters:
    uniform_depth = 0.2
    gridded_depth = None
    custom_dem = None
    overwrite_dephier = False
    custom_path = None
Using saved dephier
/Users/markwang/micromamba/envs/pgf-test/lib/python3.12/site-packages/richdem/__init__.py:3: UserWarning: pkg_resources is deprecated as an API. See https://setuptools.pypa.io/en/latest/pkg_resources.html. The pkg_resources package is slated for removal as early as 2025-11-30. Refrain from using this package or pin to Setuptools<81.
  import pkg_resources
running
ran
FSM inundation saved to pa_pluv_coast/pa_1m_fsm_inundation.tif
fill_spill_merge completed in 5.0895 seconds
Calculate coastal inundation. We apply a static ocean water level of 1.2 m NAVD88.
[ ]:
ocean_pixel = (412700, 3307700) # easting, northing of a pixel in the ocean in the DEM
pgf.c_hand(ocean_coords=ocean_pixel, gage_el=1.2)
Running c_hand with parameters:
    ocean_coords = (412700, 3307700)
    xy = True
    gage_el = 1.2
    custom_dem = None
    custom_path = None
Coastal inundation raster written to pa_pluv_coast/pa_1m_coastal_inundation.tif
c_hand completed in 0.3554 seconds
Approximiate compound coastal-pluvial inundation by taking the maximum depth over both rasters
[6]:
# open pluvial and coastal inundation rasters
with rasterio.open(pgf.fsm_inundation_path) as src:
    pluvial_inun = src.read(1)
    pluvial_inun_profile = src.profile
with rasterio.open(pgf.coastal_inundation_path) as src:
    coastal_inun = src.read(1)
    coastal_inun_profile = src.profile

# data cleaning
pluvial_inun[pluvial_inun == pluvial_inun_profile['nodata']] = np.nan
pluvial_inun[pluvial_inun <= 0] = np.nan
coastal_inun[coastal_inun == coastal_inun_profile['nodata']] = np.nan
coastal_inun[coastal_inun <= 0] = np.nan

# compound inundation: here we take max of pluvial and coastal
compound_inun = np.fmax(pluvial_inun, coastal_inun)

# save compound inundation raster
with rasterio.open(project_dir / "compound_inundation.tif", "w", **pluvial_inun_profile) as dst:
    dst.write(compound_inun, 1)
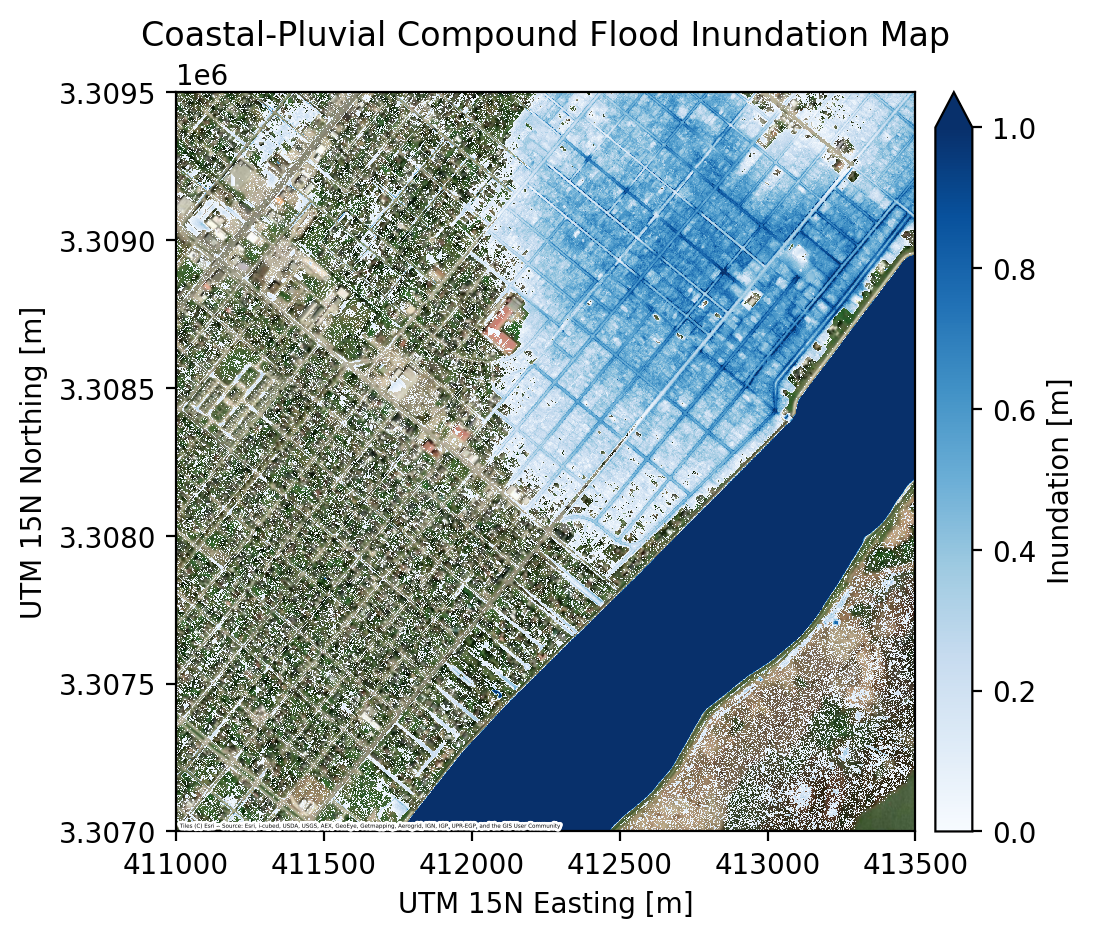
Visualize the coastal-pluvial compound inundation map
The map shows coastal and pluvial inundation for a hypothetical scenario over the northeastern portion of Port Arthur, as well as parts of the Sabine-Neches Canal and Pleasure Island.
[7]:
fig, ax = plt.subplots(dpi=200)

# show inundation map
im = ax.imshow(
    compound_inun,
    extent=plotting_extent(compound_inun, coastal_inun_profile["transform"]),
    zorder=2,
    interpolation="nearest",
    resample=False,
    vmax=1,
    vmin=0,
    cmap="Blues",
)

# add colorbar
divider = make_axes_locatable(ax)
cax = divider.append_axes("right", size="5%", pad=0.10)
fig.colorbar(im, cax=cax, label="Inundation [m]", extend="max")

# add basemap
cx.add_basemap(
    ax,
    crs=coastal_inun_profile["crs"],
    source=cx.providers.Esri.WorldImagery,
    zoom=16,
    attribution_size=2,
    zorder=1,
)

# add labels
ax.set(
    title="Coastal-Pluvial Compound Flood Inundation Map",
    xlabel="UTM 15N Easting [m]",
    ylabel="UTM 15N Northing [m]",
)

plt.show()
To inspect the results in more detail, we can view the output rasters in a GIS software like QGIS. We print the output paths below.
[10]:
print(f"Coastal inundation raster:  {pgf.coastal_inundation_path}")
print(f"Pluvial inundation raster:  {pgf.fsm_inundation_path}")
print(f"Compound inundation raster: {project_dir / 'compound_inundation.tif'}")
Coastal inundation raster:  pa_pluv_coast/pa_1m_coastal_inundation.tif
Pluvial inundation raster:  pa_pluv_coast/pa_1m_fsm_inundation.tif
Compound inundation raster: pa_pluv_coast/compound_inundation.tif